edited by
13,054 views
36 votes
36 votes
Consider the set of process with arrival time (in milliseonds), CPU burst time (in millisecods) and priority ($0$ is the highest priority)  shown below. None of the process have I/O burst time$$\small \begin{array}{|c|c|c|c|} \hline \textbf{Process} & \textbf{Arrival Time} & \textbf{Burst Time} & \textbf{Priority} \\\hline \text{$P_1$} & 0 & 11 & 2 \\\hline \text{$P_2$} & 5 & 28 & 0 \\\hline \text{$P_3$} & 12 & 2 & 3 \\\hline \text{$P_4$} & 2 & 10 & 1\\\hline \text{$P_5$} & 9 & 16 & 4  \\\hline \end{array}$$The average waiting time (in milli seconds) of all the process using premtive priority scheduling algorithm is ______
edited by

3 Answers

Best answer
66 votes
66 votes

Gantt Chart for above problem looks like :

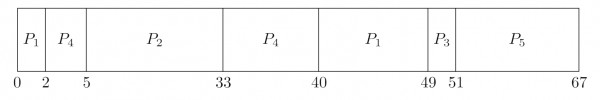
Waiting Time $=$ Completion time $-$ Arrival time $-$ Burst Time

$\sum AT = 0 + 5 + 12 + 2 + 9 = 28$

$\sum BT = 11 + 28+ 2 + 10 + 16 = 67$

$\sum CT = 67 + 51 + 49 + 40 + 33 = 240$

Waiting time $ = 240 - 28 - 67 = 145$

Average Waiting Time $ = \frac{145}{5} = 29$ msec.

edited by
1 votes
1 votes
First try to draw the gantt chart. then from than chart try to find the completion time ,turn around time and finally waiting time. So the average wt is 29msec
Answer:

Related questions

29 votes
29 votes
8 answers
3
78 votes
78 votes
5 answers
4
Madhav asked Feb 14, 2017
30,010 views
The read access times and the hit ratios for different caches in a memory hierarchy are as given below:$$\begin{array}{|l|c|c|} \hline \text {Cache} & \text{Read access ...