A live range is defined as a write to a register followed by all the uses of that register until the next write. A variable Live during it Live range.An edge between two nodes indicates that those two live ranges interfere with each other because their lifetimes overlap. In other words, they are both simultaneously active at some point in time, so they must be assigned to different registers.
| Instruction |
Live variables |
| a=1 |
{a} |
| b=10 |
{a,b} |
| c=20 |
{a,b,c} |
| d=a+b |
{c,d} |
| e=c+d |
{c,e} |
| f=c+e |
{c,e,f} |
| b=c+e |
{b,f} |
| e=b+f |
{e} |
| d=5+e |
|
Now we will draw the graph by keeping all variables as vertices and an edge between vertices if they are live simultaneously at some point in the program.
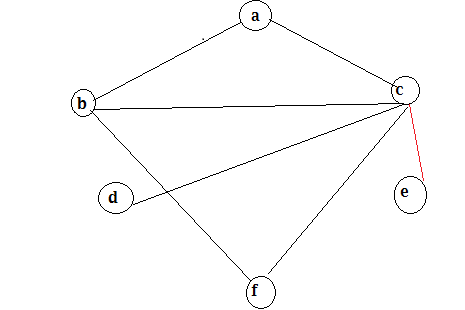
total $3$ colors required to color this graph.